
The field of meteorology constantly strives to achieve better weather forecasts by increasing the level of detail it can predict using sophisticated physics algorithms and supercomputers. Unfortunately, even with large supercomputers, there is an upper limit to the amount of physics-based models that can be computed in a timely manner. To improve on those limitations, meteorologists often use statistical techniques. We now seek to leverage more powerful AI techniques in order to achieve even better improvements in the forecasts.
This challenge is to increase the resolution (the level of detail)of 2D surface temperature forecasts obtained from Environment and Climate Change Canada (ECCC) ’s weather forecast model, using as labelled images 2D temperature analysis at higher resolution. The scale factor between the model and the higher resolution analysis is 4 (from 10 km to 2.5 km). These weather forecast gridded fields are just like images and we believe that Computer Vision algorithms would likely be excellent approaches to use.
Details:
Increased-resolution images must accurately represent reality, i.e., must demonstrate a realistic enhancement over the original low-resolution temperature forecasts.
Numerous and relevant 2D low-resolution weather forecast fields are provided as predictors in the training set. In addition to temperature, these include fields like cloud coverage, wind, humidity, topography, etc. are also included in the training set files.
We also provide thousands of images of gridded temperature analysis fields as target labels to train on, that correspond to the same dates of the training fields. Participants are to try to increase the resolution of the forecast images to look as much as possible like these higher resolution temperature analysis images. Some of the reference temperature grids, for January and July 2018, are in separate files since they are to be used to test the participant’s algorithms (models).
The data files contain two years' worth of forecast data and temperature analysis fields for every 3 hours. The participants can use all or a subset of this data for training their model, for every 3-hour period. However, the data for half of January 2018 and half of July 2018 are in two separate, test files that must be used by the participants only to calculate the final score of their model. They must not use this data in their training.
A predefined verification score is explained and provided as a script in two accompanying files. Participants are to calculate a score separately for each of the dates and times in the test files and then average all the scores together into one. Solutions (i.e., methodologies that can be reproduced) will be ranked using this score and evaluated.

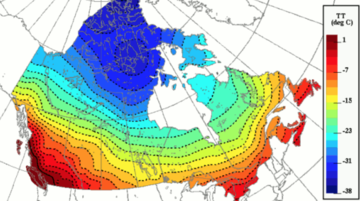
Provided here are examples of a temperature field over Western Canada at low resolution (10 km – left) and high resolution (2.5 km – right). The increase of resolution represents a factor of 4. The low-resolution image represents a weather model forecast field that runs on our supercomputer, whereas the high-resolution image represents the observed temperature field (the truth). Running a weather model at 2.5 km grid is much more computationally expensive than at 10 km resolution. We would like to see if a Super Resolution algorithm can accurately generate the details found in the 2.5 km-resolution observed field using as input the 10 km resolution model forecast fields. These model forecast fields include not only temperature but also a bunch of addition weather fields, such as wind, humidity, etc.
To complete this challenge, please provide the following:
- A detailed description of the methodology employed to solve the problem.
- All the scrips and source code used; or if source code refers to a software package or language, the versions used.
- The code should be clear and with enough comments to be easily understandable by the judges.
- The final model saved at the end of the training, as well as instructions to load and run this model.
- A plot of the score evolution through training (training set and validation set).
- The scores for each date and time of the test set and the average of these scores that will be used as the grade achieved by each participant. The lower the score (which is and equivalent rms error) the better.
- And anything else we might need to reproduce the answers of the participants.
You can download the relevant files at this link. Due to the file size, it may take a moment to complete download.
For information on score function and input descriptions, see the attached documents.
-
Submissions will be graded on the following criteria:
- Meets Deliverables
- Creativity
- Clarity
will receive $1,000
will receive $200 each
| $1,000.00 |
|
Stéphane Ménard Polytechnique Montreal | |
| $200.00 |

|
Christopher Wolfram Brown University | |
| $200.00 |

|
Thanh Nguyen The Catholic University of America | |
| $200.00 |

|
Nicolas Brown McGill University |